
Examination Results Analytics
Please note that this article was published in 2019 and may no longer be accurate
Explore a wealth of attainment data via an interactive analytics dashboard
Successful curriculum design and positive improvements to teaching practices depend on the ability to monitor outcomes of teaching and learning processes. Data analysis of attainment and examination results can help educators reflect on the efficacy of their approaches to teaching, and support all students to achieve their full potential. It is with these goals in mind that the Business Information team, along with Academic and Financial Planning and Analysis, have developed an Examination Results Analytics dashboard to replace the annual publication 'Undergraduate Examination Results'.
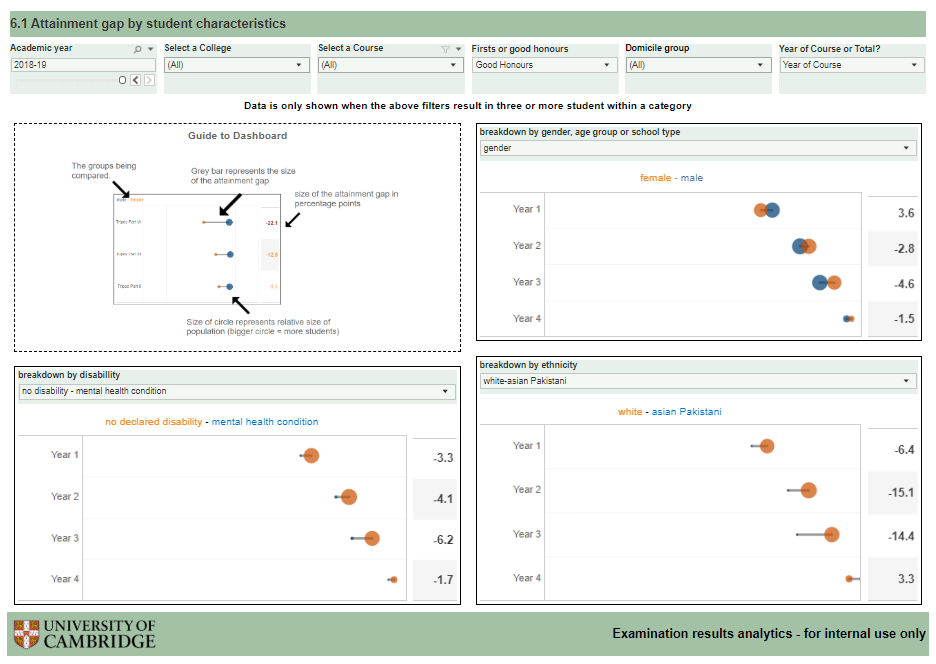
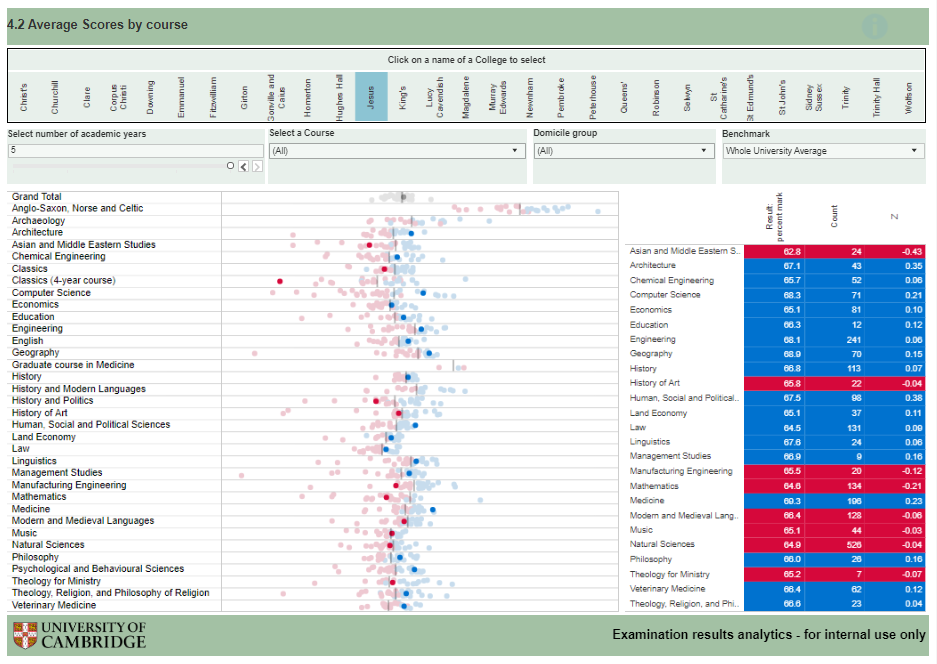
The dashboard presents detailed analysis of student attainment by college and course, based on three different measures – class, per cent mark and rank (the latter for 2018-19 onwards only). It also includes analysis of attainment broken down by various characteristics, such as gender, ethnicity and disability. Finally, it examines outcomes from the most recent academic year’s examinations and provides time series comparison with previous years’ results.
The dashboard design is interactive; in other words, it enables you to choose exactly the particular aggregation of data you want to explore, or simply allows you to narrow down the data to your own course or College only.
The underlying data is extracted from the University student records system CamSIS on 31 July each year – this date is chosen for year-on-year consistency as there is always some natural fluctuation in numbers through the summer due to ongoing appeals. Following data extraction, there is a period of quality assurance and checks, after which the results are published in mid-August.
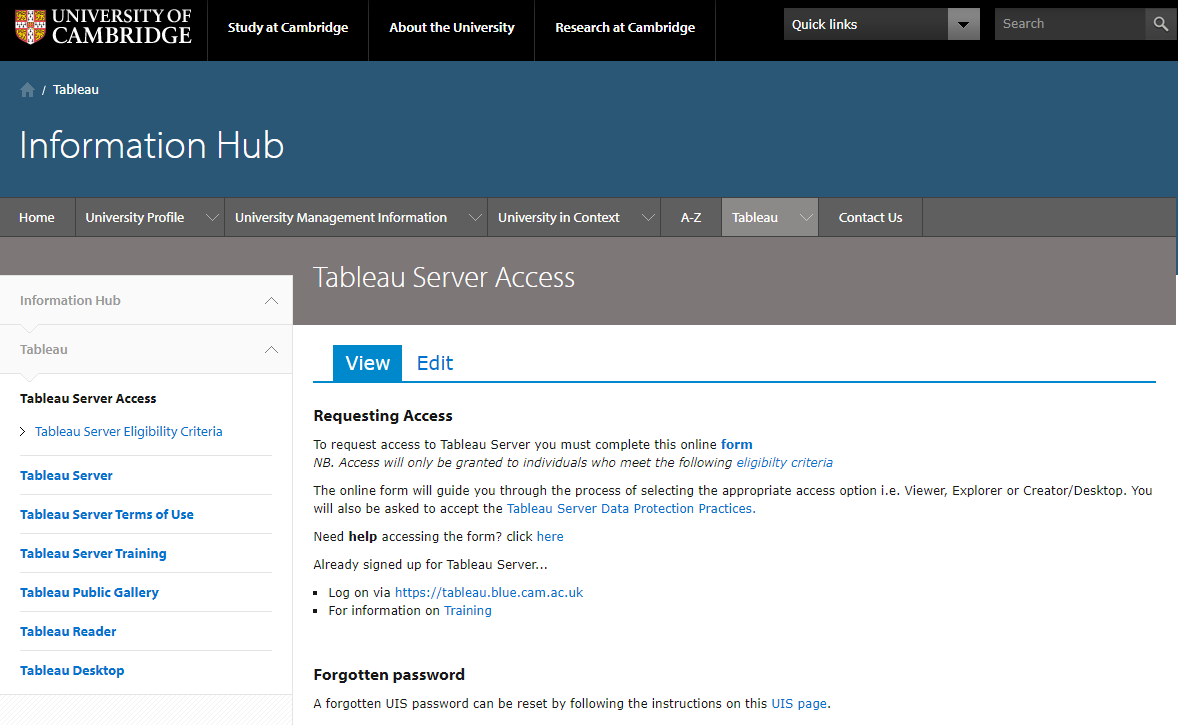
This dashboard is available to all University and College staff on the secure online platform Tableau Server. If you wish to access the Examination Results Analytics dashboard for the first time (or many other dashboards of wide-ranging data sources such as student survey results or research activity), please complete the online form to request access to Tableau Server. The form is designed to ensure compliance with the GDPR requirements related to data access. Please request Viewer type access, which will enable you to use all dashboards that have been created by the central University offices. It takes around 1-2 working days for requests to be processed.
The Business Information team offers informal one-to-one 30-minute Tableau Server drop-in sessions at the Old Schools every Tuesday afternoon for any questions or discussion of the data available on the Tableau Server, including Examination Results Analytics. We ask that attendees book a slot and let us know of any questions or topics that you want to cover in advance so that we can prepare for the session.
During the development of the Examination Result Analytics dashboard we received lots of very helpful feedback and support from various members of staff, including Senior Tutors, departmental and college administrators and many others. It is important for us that we continue to receive feedback, so that we can further enhance the tool and add the analyses, disaggregations and benchmarks to enable greater evaluation of teaching practices and support offered to students, to achieve the best possible results. We would welcome any questions, comments and suggestions sent to business.information@admin.cam.ac.uk.
Authors

Dr Katya Samoylova is a Senior Information Analyst in Academic and Financial Planning and Analysis. She is responsible for student number reporting to external bodies as well as providing internal management information on student registration and attainment.

Dr Laura Hall is a Management Information Analyst in Academic and Financial Planning and Analysis. Her work concentrates on the design of Tableau dashboards covering a wide range of topics from attainment to student survey results to league table analysis.
Cambridge Teaching & Learning Newsletter vol. 1 (issue 2) November 2019